
Turbulence Areas – Areas expected to experience light turbulence are green, areas expected to experience light to moderate turbulence are yellow, areas expected to experience moderate to severe turbulence are red, and areas expected to experience severe turbulence are purple.
Turbulence Reports — Pilot Reports containing turbulence are depicted in yellow. Included from top to bottom are: Flight Level in hundreds of feet, aircraft type / time of report in UTC, and the intensity of turbulence reported. A turbulence symbol also represents the intensity of turbulence. The diamond shape indicates the position of the aircraft when the report was issued.
AIRMETS — Turbulence AIRMETS are graphically as solid red lines. The intensity of the expected turbulence is depicted using turbulence symbols. The altitude range of the turbulence is labeled to the right of the turbulence symbol, with the upper altitude to the upper right, and the lower altitude to the lower right. If the lower altitude is not present, it is understood that the ground represents the lower limit. Altitudes are labeled in hundreds of feet. The start and expiration time of the AIRMET is depicted below the turbulence symbol, with the two digit day of month followed by the 4 digit hour and minute in UTC. Turbulence AIRMETS (named TANGO) are issued for areas expected to experience moderate turbulence (outside of convective activity).
Maps are updated every hour and are available between 30 and 45 minutes past each hour.
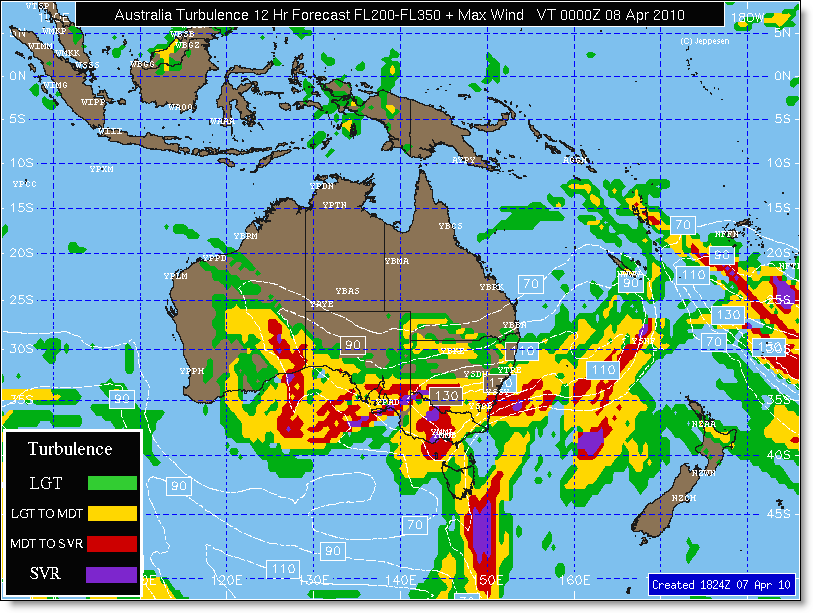
Turbulence Areas – Areas expected to experience light turbulence are green, areas expected to experience light to moderate turbulence are yellow, areas expected to experience moderate to severe turbulence are red, and areas expected to experience severe turbulence are purple.
Maps are updated 4 times per day and are valid at 0400, 1000, 1600 and 2200 UTC. Maps are available approximately 4 to 6 hours prior to the valid time of the map.