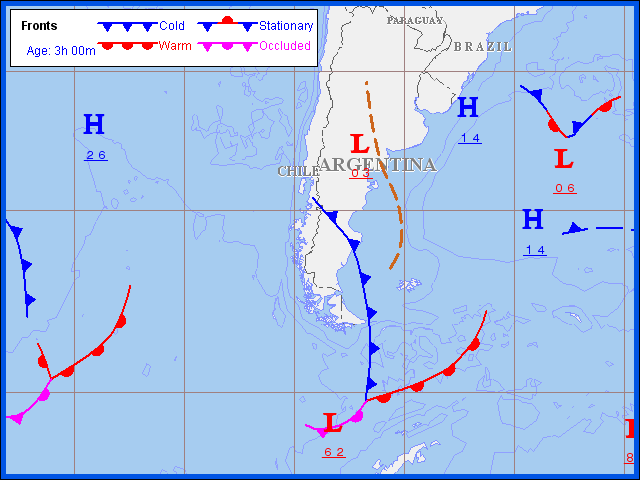
Cold fronts are depicted by dark blue lines with triangles.
Warm fronts are depicted by red lines with half-circles.
Occluded fronts are depicted by purple lines with purple triangles and half-circles.
Stationary fronts are depicted by alternating red lines with a half-circle and blue lines with a triangle.
Surface Troughs are dashed brown lines.
A blue H denotes a center of high sea-level pressure, and a red L denotes center of Low sea-level pressure. The value of the central pressure is labeled beneath the center letter with the last two digits (same as for isobars).
Surface Analysis maps are drawn by Jeppesen meteorologists who analyze the latest METAR observations in conjunction with radar and satellite imagery.
Maps are valid at time of the observations, and are prepared for valid times of 0000, 0600, 1200 and 1800 UTC. Maps are available between 1½ and 2½ hours after the valid time.
Surface Weather Forecast maps depict conditions from the surface to FL240 and are created by Jeppesen meteorologists using numerical forecast guidance and current observations. Maps are created for 12- and 24-hour forecast periods for various regions. Some regions only have a 24-hour forecast available, and some maps have different information available.
Valid times for 12-hour forecasts are 0000, 0600, 1200 and 1800 UTC. Produced four times per day, 12-hour maps are available at 0130, 0730, 1330 and 1930 UTC.
Valid times for 24-hour forecast maps are 0000 and 1200 UTC. Produced twice daily, 24-hour maps are available at 0130 and 1330 UTC.
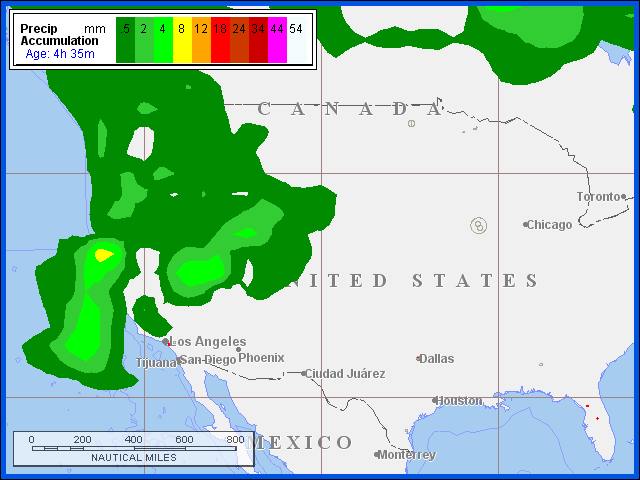
Forecast precipitation accumulation is depicted using colors that represent the amount of precipitation that is forecasted to fall during the 6-hour period prior to the map valid time. For example, a map with a valid time of 1200 UTC depicts the amount of precipitation forecasted to fall between 0600 UTC and 1200 UTC. Forecast precipitation is derived from numerical forecast models.
Models are run every 6 hours and extend 72 hours into the future at 6-hour forecast time intervals.