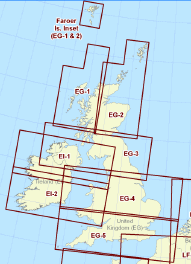
Chart outlines are the edges of the raster charts made visible on the screen, representing each of the raster charts available to view. In the split screen view, the chart outlines are displayed or hidden in the active view, which is designated by a blue border.

To display or hide chart outlines:
Click Chart > Show Raster Outlines or Chart > Hide Raster Outlines.
Click on the Show/Hide Outlines button on the Chart toolbar.
You can also display chart outlines when loading the charts by right-clicking in the Enroute Charts View, clicking Properties, selecting the Raster Charts tab, and selecting the Show Chart Outlines check box.
See Also: