To load a raster chart from a CD:
Place the CD in the CD-ROM drive.
Use of the following methods to load the charts:
Click Chart > Load Charts > [Vendor Name].
Right-click a blank area in the Enroute Charts view and choose Load Charts > [Vendor Name].
Wait a couple of seconds and FliteStar will begin preparing the charts. When FliteStar has loaded the charts, it displays them in a mosaic mode where they are all available for viewing at the same time.
If charts are available in more than one location (on the hard drive and CD-ROM for example), FliteStar asks which chart set you want to load. See Saving Charts to the Hard Drive.
If you already have charts loaded, you are asked if you want to Unload Existing Charts. Choose Yes to change chart coverage. If FliteStar does not automatically begin loading the new charts:
Right-click a blank area in the Enroute Charts view and choose Properties from the shortcut menu.
On the Raster Charts tab, verify that the directory path is correct.
If necessary, click Browse to navigate to the folder containing the desired charts.
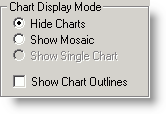
There are a couple of different options for displaying raster charts in FliteStar. To view the raster chart options:
Right-click a blank area in the Enroute Charts view and choose Properties from the shortcut menu.
Click the Raster Charts tab.
These options are available in the Chart Display Mode section. The default is set to hide charts.

Use one of the following methods to display only a specific chart:
Right-click the chart outline on the enroute chart and choose Display Chart.
Right-click a blank area in the Enroute Charts view and choose Properties from the shortcut menu. Select a chart in the Raster Charts tab, select the Show Single Chart option, and then click OK.
FliteStar moves and scales the view to center on the selected chart.
The mosaic mode displays raster charts as one seamless electronic chart. Mosaic refers to the visual overlapping of adjoining charts to create, in essence, one chart. In the mosaic mode you can scroll and zoom from one chart to another anywhere within the region you have loaded. Jeppesen recommends this option unless you know the exact chart you want to display.
If you have elected to display a single chart and would like to show all the charts in mosaic mode, do either of the following:
Click Chart > Load Charts > Enable Mosaic.
Right-click an open area in the Enroute Chart view and choose Enable Mosaic.
Use one of the following methods if you do not want the raster charts displayed when you return to the Enroute Charts View:
Click Chart > Hide Charts.
Click the Show/Hide Raster button on the Chart toolbar.
The charts will be loaded, but will not display until you click Chart > Show Charts or click the Show/Hide Raster button again.
If you have zoomed too far in or out to match the scale of the raster charts, the vector chart will appear with a shaded area representing the area covered by the loaded raster charts.
To move back a view, click the Previous View button on the Chart Toolbar.
To find a new location:
Click Chart > Full Zoom Out.
Locate the area covered by the raster set.
Use the zoom box to quickly view smaller areas.
These methods also work if you "lose" the charts by panning beyond the chart set coverage area. If you do not see the raster chart you expect:
Zoom to a full view of your area of interest.
Click Chart > Show Raster Outlines to display the borders of the raster charts.
Click a chart outline near what you want to view.
If a pink highlight appears, hover the cursor to display a tooltip with the file name, scale, and chart name. When more than one chart border is represented, an information box offers you a selection of charts.
After you have located the chart you want, right-click to view that chart or drag zoom in to an area within the highlight.