This feature is only available when JeppView 3 is installed on the same machine.
Navigating in the Terminal Charts view is similar to navigating in the Enroute Charts view. Scrolling and zooming functions, as well as the Next and Previous functions, are the same as for enroute charts.
To scroll in the Terminal Charts view, do either of the following:
Point to the edge (or corner) of the Enroute Charts view window. The mouse pointer turns to an arrow.
Click to move in that direction. Hold down the mouse button to auto-pan. The chart view continues scrolling until the mouse button is released.
Press the UP, DOWN, LEFT and RIGHT ARROW keys.
The Next View and Previous View commands allow you to navigate forward and backward through a history list of actions and charts displayed in the Terminal Charts view. History includes the chart being displayed, the location on the chart, and the zoom level.
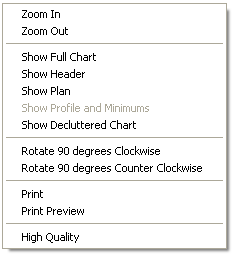
For terminal charts, FliteStar provides a right-click menu with commands for quick viewing of chart sections, decluttering, rotation, and printing, all described below.
Right-click on the chart and choose Zoom In.
Click the Zoom In toolbar button.
![]()
Click Chart > Zoom In.
Press the PLUS SIGN (+) key on the keyboard.
Use the drag zoom feature.
Choose Zoom Out from the right-click menu.
Choose the Zoom Out toolbar button.
![]()
Click Chart > Zoom Out.
Press the MINUS SIGN (-) key.
The following right-click menu commands allow you to zoom in on the different terminal chart sections:
Show Header zooms in on the header portion of the terminal chart.
Show Plan zooms in and centers on the map portion of the terminal chart.
Show Profile and Minimums zooms in and centers on the profile and minimums portion of the terminal chart. When a profile and minimums section is not available on the chart (VFR Bottlang charts), the Show Profile and Minimums option is not available.
These commands work only for geo-referenced charts and are not available for airspace, arrival, departure, some airports, and noise charts.
To return to viewing the entire chart, right click and select Show Full Chart.
When changing locations on the terminal chart, click Show Full Chart and then zoom back in on your desired view.
In the chart view area right-click menu, click Show Decluttered Chart to de-emphasize the colors of terrain, roads, cities, and other non-navigational features. The features fade to a light gray.
Decluttering only applies to the chart in view. To restore the colors, select another chart or uncheck this option.
Decluttering does not affect the printed chart.
To rotate a terminal chart 90 degrees clockwise or counter-clockwise, right click and select the Rotate 90 Degrees Clockwise or Rotate 90 Degrees Counter Clockwise command.
Print or preview the chart in view.
FliteStar displays terminal charts on the screen in High Quality ( HQ) mode by default. HQ sharpens and thickens terminal chart characters for easier readability, and has more shading around text. It may look fuzzy up close, but it is generally clearer at a distance. The differences between enabling HQ mode and disabling HQ mode are more apparent on an LCD screen than on a CRT screen.
To disable HQ mode, right-click in the Terminal Chart View, and then choose High Quality Mode to clear the check mark.
To enable HQ, choose the High Quality Mode command again.
See also: