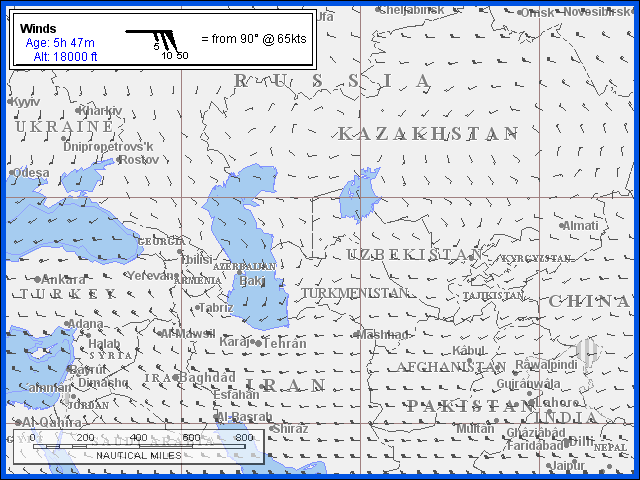
The Wind maps depict the analysis or forecast of upper level winds. Wind speed and direction is depicted using standard wind flags. Wind speed is calculated by adding all of the shaded triangles (50 kts each) and barbs (10 kts for full barb and 5 kts for half barb) on each flag. For example, two triangles and one barb would represent a wind speed of 110 kts. Wind direction is determined by the orientation of the flag. Wind is blowing from the tail of the flag (where flags are) to the head of the flag (where the dot is).
Wind flags are positioned at the optimum resolution for the map area. Most flags are placed every 2.5 degrees of latitude (150 nm) and longitude. For smaller geographic regions such as the regional U.S. maps, flags are placed every 75 nm.
Maps are created based upon the availability of numerical model data. For the U.S., analysis maps are updated hourly. Forecast maps for the U.S. and International areas are updated every 6 hours based on model run times of 0000, 0600, 1200 and 1800 UTC. Map forecast times of 06, 12, 18, 24, 30, 36, 42, 48, 60 and 72 hours are available approximately 4-6 hours after the model run time..
Upper Level Wind maps are generated for the following atmospheric levels:
Altitude |
Pressure |
FL050 |
850 mb |
FL100 |
700 mb |
FL180 |
500 mb |
FL240 |
400 mb |
FL300 |
300 mb |
FL340 |
250 mb |
FL390 |
200 mb |
FL450 |
150 mb |
See also: