
Downloaded JeppWX winds aloft and icing areas display in the Profile View as well as cloud bases, thunderstorms, and precipitation (rain, mixed snow and rain, and snow) from METARs.
If the sky is clear, no cloud symbols appear, but you can tell the cloud data is turned on because FliteStar displays the following.
WARNING--ALTITUDE OF CLOUD TOPS NOT KNOWN
If you don’t see that warning, right-click a blank area in the profile view and make sure Show Clouds is selected.
The Profile view also displays precipitation. The cloud and precipitation symbols depict this type of activity qualitatively based on METAR text data.
| WARNING | Do not use the profile display as a substitute for an approved weather briefing! |
View the weather data from which the symbol was generated by hovering your mouse pointer over the symbol. To see the full text descriptions, view the Airport Properties > Weather tab for an airport in the Enroute Charts view.
| WARNING | These cloud depictions are based on METARs from
weather stations within a specific distance. You cannot infer
that the clouds and weather are as depicted away from the reporting
stations.
EXAMPLE: Suppose you are flying down the west side of a mountain range and the nearest METAR report is from an airport on the east side of the mountains. It could be clear at that airport, but there could be clouds and precipitation along your route. |
Winds aloft are displayed on the Enroute Charts and Profile views when winds are enabled in the Weather toolbar.
In the Profile View, winds are displayed as blue arrows at different altitudes. The arrow length indicates the relative strength of the wind component. The longer the arrow the faster the wind speed. To view the direction, speed, headwind, and crosswind for a specific wind and altitude, hover your cursor over the blue wind arrow to see the text description in a tooltip.

Icing areas are displayed in the Profile view when Icing is enabled in the Weather toolbar. Icing areas appear as turquoise blue blocks. Hover the mouse on any area border to view a tooltip with the altitudes for that block.
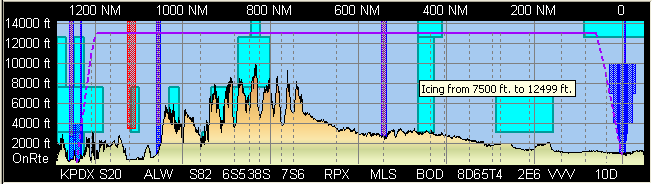
Icing area data is derived from the live weather Icing downloads. The snow symbols drawn from METAR data may not match the icing areas, as they come from different reporting sources.
See also: