The Time Slider is a new control for viewing the live chart weather overlays at different times in the past, present, and future. You can also use the slider to find the times when an individual weather product is available.
To run the Time Slider multimedia Flash tutorial, go to the FliteStar Technical Support page at Jeppesen.com.
The Time Slider is loaded with information. Click an orange arrow in the image below to jump to the section about that slider component::
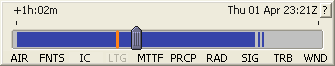
The times shown above the timeline, including the orange present time
indicator ![]() ,
are based on your computer clock.
,
are based on your computer clock.
When you first open FliteStar 9.5, the time slider ![]() is positioned at the current time on the timeline, covering the orange
bar. As time passes, the slider position maintains its position at
the current time.
is positioned at the current time on the timeline, covering the orange
bar. As time passes, the slider position maintains its position at
the current time.
You can move the time slider three ways:
· Place the mouse cursor over the slider, hold down the left mouse button, and drag the slider left and right.
· Click in the timeline on either side of the slider.
· Click in the Slider window, then tap or hold down the left and right keyboard arrow,or page UP/DOWN keys.
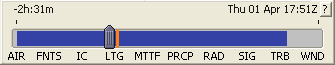
The times shown at the top left and top right of the Time Slider control show the slider position relative to the current time.
In the illustration below, the time at the top left, ![]() ,
shows that the slider position was 2 hours and 31 minutes in the past from
the time this picture was taken. The slider position calendar date and
time at the top right,
,
shows that the slider position was 2 hours and 31 minutes in the past from
the time this picture was taken. The slider position calendar date and
time at the top right, ![]() ,
was also 2 hours and 31 minutes in the past, relative to the orange present
time indicator.
,
was also 2 hours and 31 minutes in the past, relative to the orange present
time indicator.
The dark blue area of the timeline indicates the timespan for which weather data is available for at least one product. The gray areas show the times for which no weather data is available for any product.
The abbreviations below the timeline represent the individual live weather products. Hovering the mouse over an abbreviation does two things:
· Displays a tooltip with the full product name. Tooltips for icing, turbulence, and winds aloft also show the altitude range for which information is available.
· Shows the time span for which data is available for that weather product in light blue.
Click an abbreviation to keep the light blue time span for that product in view as you move the mouse elsewhere. Click again on the abbreviation to restore the dark blue time span of all products.
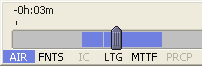
When a product abbreviation is solid black, such as IC, PRCP and WND below, information for that product is available at the time slider position. When no information is available at the slider position, the product abbreviation turns light gray, as with AIR and FNTS below.
When a weather product abbreviation is not visible on the timeline at all, it means no data for that product has been downloaded for any time within the timeline. "N/A" in the Weather Legend age also indicates that either no data is available, or the download is still in progress.
Use the Time Slider control in conjunction with the Weather toolbar to view weather on the chart at different times.
Show the product in the toolbar by clicking its button if it is not already on. For icing, turbulence, and winds aloft, set an altitude with the Set WX Altitude button.
Move the time slider to a time when data for that product is available.
To view weather at different times in the Enroute Charts view:
past reports, move the slider to the left of the orange present time bar. Slider time at the top left shows (-). |
ï |
current weather, move the slider over the orange present time indicator bar until the time at the top left reads "0h:00m" |
ð |
forecasts, move the slider to the right of the orange present time bar. Slider time at the top left shows (+). |
| NOTE | Forecast products such as Forecast Precipitation Accumulation may overlap over time. That is, when FliteStar has been downloading data for a few hours, and the time slider is set to the present moment, the precipitation accumulation display may be from a forecast up to 6 hours old. |
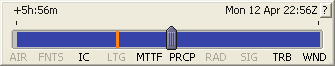
When you plan a route within the Time Slider time span, the slider position is also shown in hours and minutes before (-) or after (+) the route departure time, just after the slider time +/- the present. A blue-green bar above the timeline depicts the time span of your route in relation to the timeline and all available weather.
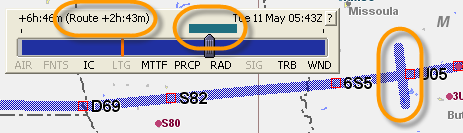
In the Enroute Charts view, a tic mark along the route corresponds to the slider position on the timeline.
Move the time slider to view reported or forecast weather at different times along the route.
See also:
Setting an Altitude for Live Weather Overlays
To hide or show the Time Slider control do either of the following:
· In the View menu uncheck or check Time Slider.
· Use the keyboard shortcut Ctrl+N.
To move the Time Slider control, grab the title bar with the mouse and drag it to a new location.
To re-size the Time Slider control, hover the mouse over the left or right edge until the double arrow appears, then drag the edge to widen or narrow the window. The Time Slider does not re-size vertically.